How I Generated 3 Colour Possible Grosvenor Longwall Goaf Gas Explosibility Diagram , LW 104 “Little Britton” Ventilation Arrangement
There are 2 rarely if ever discussed and referenced goaf gas diagrams in the ACARP Optimisation of
Inertisation Practice Report 1996 (Balusu Michael Wendt and Sheng Xue)
The authors description and the diagrams are on pages 62 and 63 respectively of (74 and 75 of 128).
https://www.qldminingcrisis.com.au/wp-content/uploads/2021/03/C9006_Report-Newlands-Sealing.pdf
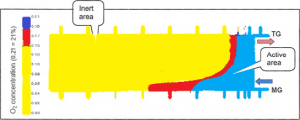
To generate the 3 colour LW 104 Little Britton diagram, I used the information and principals of these two diagrams and the 2005 Balusu Ting diagram subject to evidence and testimony at the Grosvenor Inquiry, after I had them converted to the 3 colour goaf explosibility diagram.
There is no short way to describe how I generated the 3 colour LW 104 Little Britton without being accused of just making it up.
(The diagrams and authors description from ACARP Optimisation of Inertisation Practice Report 1996 are included later in the post
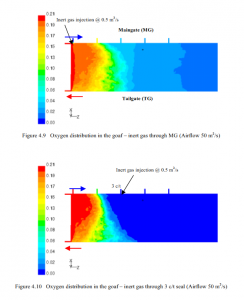
The principals used are those best displayed in the 50 m3/s diagram from 1996 and described as
- intake airflow/oxygen has penetrated up to 100 m behind the face on maingate side even against the buoyancy pressure of methane gas.
- However, the air and gas mixture penetrated deep into the goaf at lower elevation tailgate side due to buoyancy effects. For example, oxygen concentration was above 10% even at 250 m behind the face on tailgate side.
- These simulation results indicate that intake airflow rate would have a significant effect on goaf gas flow mechanics during longwall retreat operations.
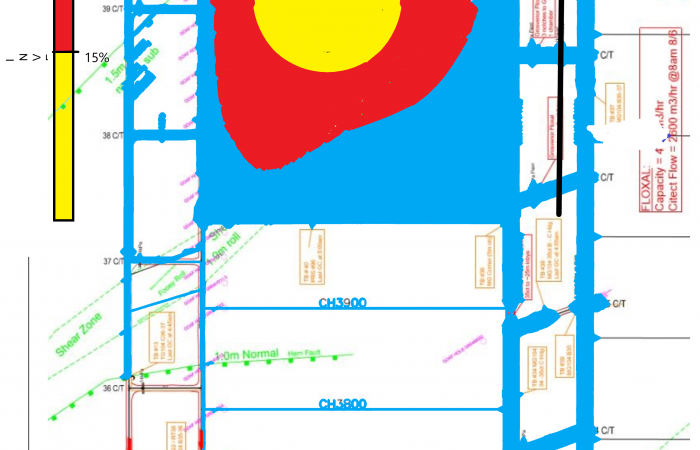
With LW 104 Little Britton Ventilation arrangement the diagram has to take account of several factors.
- Positive pressure intake shaft at back of goaf pushing intake air around the back and sides of the goaf past all of the goaf seals erected in 104 block and then onto the longwall face. Therefore Oxygen rich zones are shown in the immediate vicinity of each goaf seals.
- Higher goaf differential pressures due to Little Britton ventilation arrangement and the higher ventilation quantities (70 m3/s vs 50m3/s).
- Relatively small size of LW 104 than example which is a completed longwall ready for take-off.
- Grosvenor has much greater residual methane content in the goaf per tonne of coal
- Effect of Methane Drainage Boreholes.
These principles and factors led to the creation of the 3 colour Grosvenor Longwall Goaf Gas Explosibility Diagram , LW 104 “Little Britton” Ventilation Arrangement.
It is not, and cannot be a definitive reflection of what the situation exactly was in LW 104.
That would have required Grosvenor Mine
- Undertaking a constant Proactive sampling of the goaf atmosphere and recording differential pressure over time of all goaf seals and goaf boreholes.
- Then over time build up picture of how the goaf atmospheric at any specific point mix alters over time until it reaches a stable inert atmosphere (starting at the back of the goaf at the installation road).
- Monitoring the goaf for pressure differential and gas content to understand changes to goaf gas behavior due to ventilation and differential pressures when they occur
Unfortunately the Grosvenor Inquiry has already heard that Grosvenor Management did not do any of these activities.
Whatever criticism I will likely receive from all the defenders of Anglo and any interested students of mine ventilation, please do not get caught up as to exactly where the zones are and the relative size of the zones. If anyone wants to discuss the principles and if I have overlooked something relevant, that is fine.
ACARP Optimisation of Inertisation Practice Report 1996
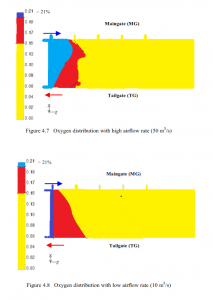
The situation described ACARP Optimisation of Inertisation Practice Report 1996 is a conventionally ventilated retreat longwall face gas distribution at takeoff position showing oxygen penetration into the goaf under two different radically different ventilation quantities and therefore differential pressure. The ventilation quantities shown are firstly at 50 m3/s and then at 10 m3/s.
Firstly please read the excerpt and study the attached diagrams
https://www.qldminingcrisis.com.au/wp-content/uploads/2021/03/C9006_Report-Newlands-Sealing.pdf
4.4.1 Steady state simulations
(a) Effect of airflow rate (Comparison – high and low airflow rates)
In these studies only airflow into the panel was changed to simulate its effect on goaf gas distribution. Airflow was changed from 50 m3 /s in the first model to 10 m3/s in the second model.
All other model parameters and boundary conditions remained identical in both the models.
Oxygen distribution in the goaf under 50 m3 /s and 10 m3/s airflow conditions are presented in Figures 4.7 and 4.8 respectively. Goaf gas emission flow rate was about 0.6 m3 /s of methane in both the models.
Comparison of the figures 4.7 and 4.8 shows a wide variation in goaf gas distribution.
For example, Figure 4.7 shows that intake airflow/oxygen has penetrated up to 100 m behind the face on maingate side even against the buoyancy pressure of methane gas.
Whereas in the case of low airflow rate conditions, buoyancy forces seem to have major effect on goaf gas distribution, as shown in Figure 4.8. In this case, fresh air penetration into the goaf on intake side was very short at less than 30 m.
However, the air and gas mixture penetrated deep into the goaf at lower elevation tailgate side due to buoyancy effects. For example, oxygen concentration was above 10% even at 250 m behind the face on tailgate side.
These simulation results indicate that intake airflow rate would have a significant effect on goaf gas flow mechanics during longwall retreat operations.
Pressure equals the Resistance by Quantity Squared.
So the pressure differential acting on the goaf at 50 m3/s is Twenty- Five (25 ) times that at 10m3/s.
The effects of running a much lower pressure differential are self evident, with much less Oxygen penetration into the goaf and the explosive zone and inert zones move much closer to the face
To generate the 3 colour LW 104 Little Britton diagram, I used the information and principals of these two diagrams and the 2005 Balusu Ting diagram subject to evidence and testimony at the Grosvenor Inquiry, after I had them converted to the 3 colour goaf explosibility diagram.